Mastering AWS CloudWatch: Monitoring, SNS topic & CloudWatch dashboard


In the ever-evolving world of cloud computing, effective monitoring is the key to ensuring the reliability, performance, and security of your applications and infrastructure. Amazon Web Services (AWS) offers a robust monitoring and alerting service called AWS CloudWatch, which provides deep insights into the health of your resources and applications in the AWS environment.
In this blog, we embark on a journey to demystify AWS CloudWatch and guide you through the process of configuring it to monitor a crucial metric: CPU utilization. But that's not all; we'll also explore how to set up Simple Notification Service (SNS) topics to receive notifications when CPU utilization breaches predefined thresholds. Finally, we'll top it off by creating a CloudWatch dashboard that centralizes your key performance metrics, providing a visual snapshot of your AWS resources' health.
Whether you're an AWS enthusiast, a DevOps engineer, or a cloud newbie, this blog aims to simplify the process of harnessing AWS CloudWatch's power. By the end, you'll be equipped to monitor your AWS resources effectively and proactively respond to any performance issues, keeping your applications running smoothly in the cloud.
So, let's dive into the world of AWS CloudWatch and take control of your AWS environment's monitoring and alerting capabilities. Following are steps we followed
Create an EC2 instance
Create CloudWatch for CPU Utilization
Create a SNS topic alarm and get notified on email.
Create a CloudWatch dashboard for monitoring.
Lets start with creating EC2 instance.
Create an ec2 instance:
Let's create an ec2 instance and launch the instance named CloudWatch-Demo. I am creating instances with free tire configurations.


I have a Python application created by Abhishek Veeramalla for make increase or decrease CPU utilization and I'll show you how this information is collected in this dashboard. Usually increasing and decreasing the CPU is not that easy task so this Python script will help in that case.
You can also use it for your demo purposes but it's not recommended to use in the production.
The cpu_spike.py this python script is going to increase and decrease
the CPU usage on this ec2 instance and I'll track that Matrix information on the CloudWatch as Cloudwatch collects the information and it will give you the dashboards It will help you in creating alarms and send you notifications.
Let me show you practically how a DevOps engineer uses these metrics.
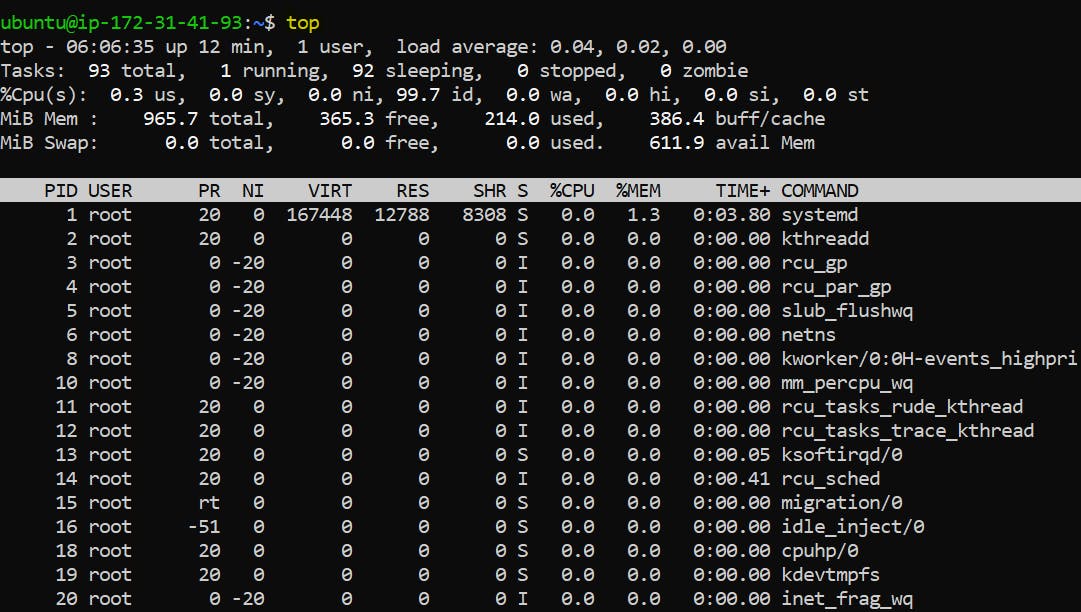
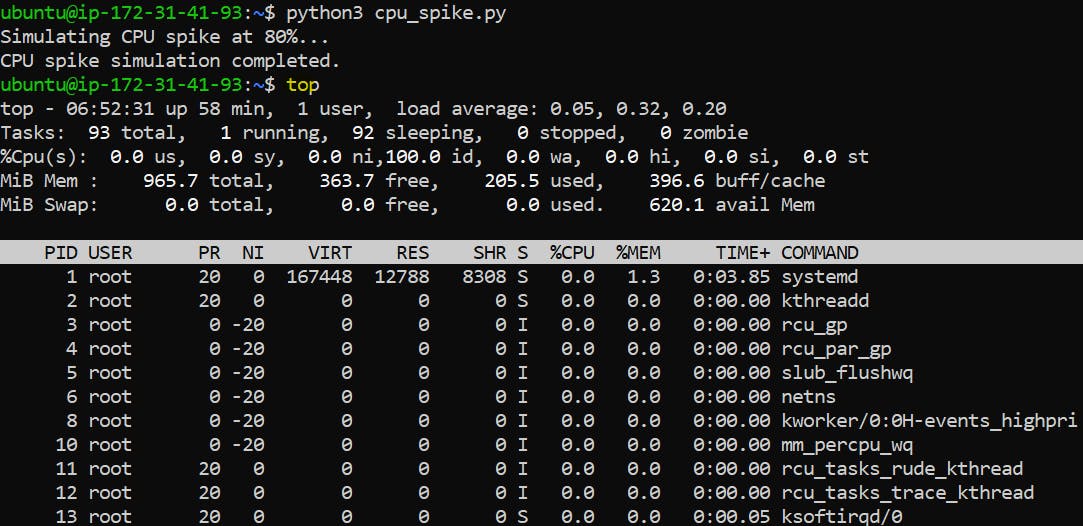
Go to the EC2 instance let's connect to it through SSH.
Now, the instance has just started so you use the top command to check CPU utilization, we can see everything is very normal.
Create CloudWatch for CPU Utilization:
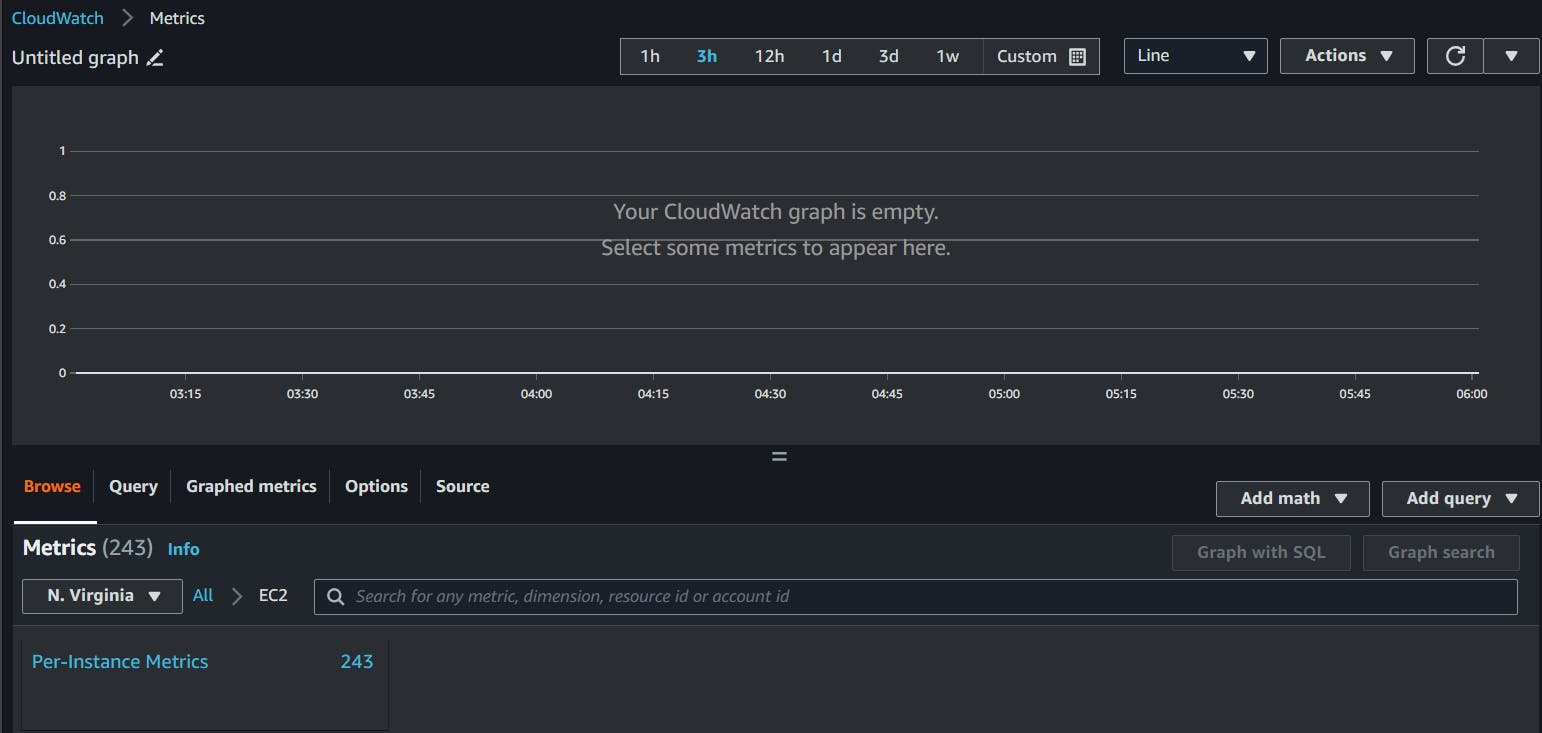
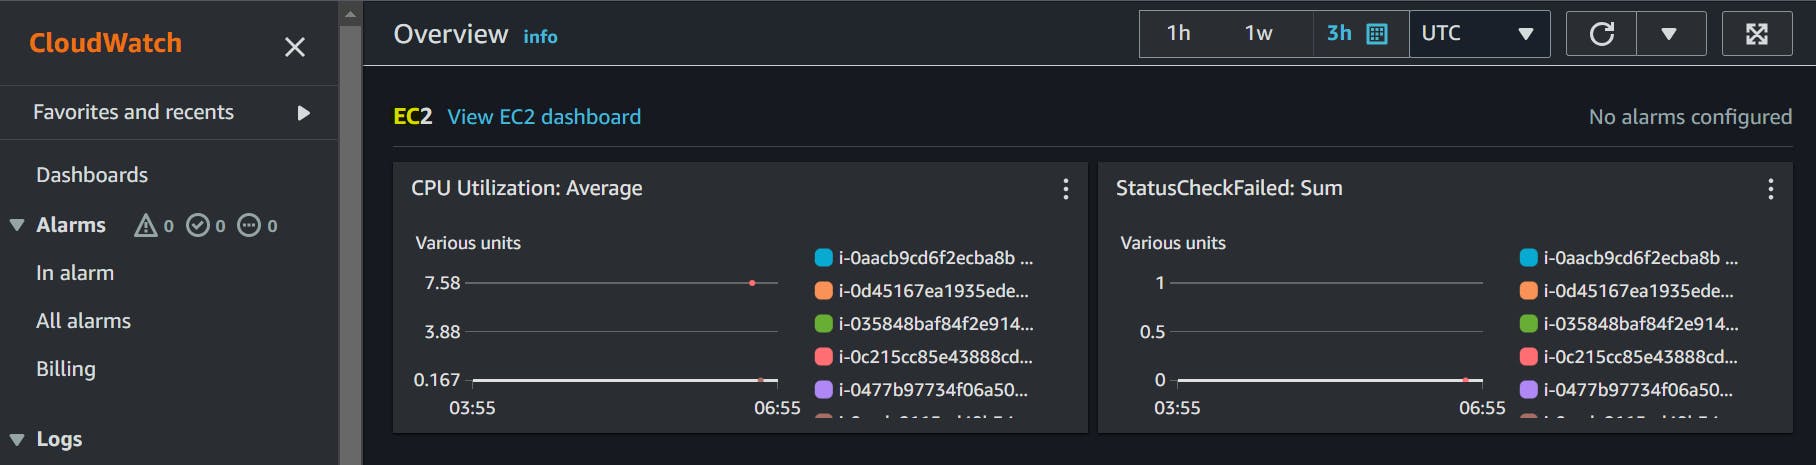
Now, go to CloudWatch and click on the EC2 and let's track the metrics of the EC2 instance that we just created.

Click on Per-Instance Metrics.
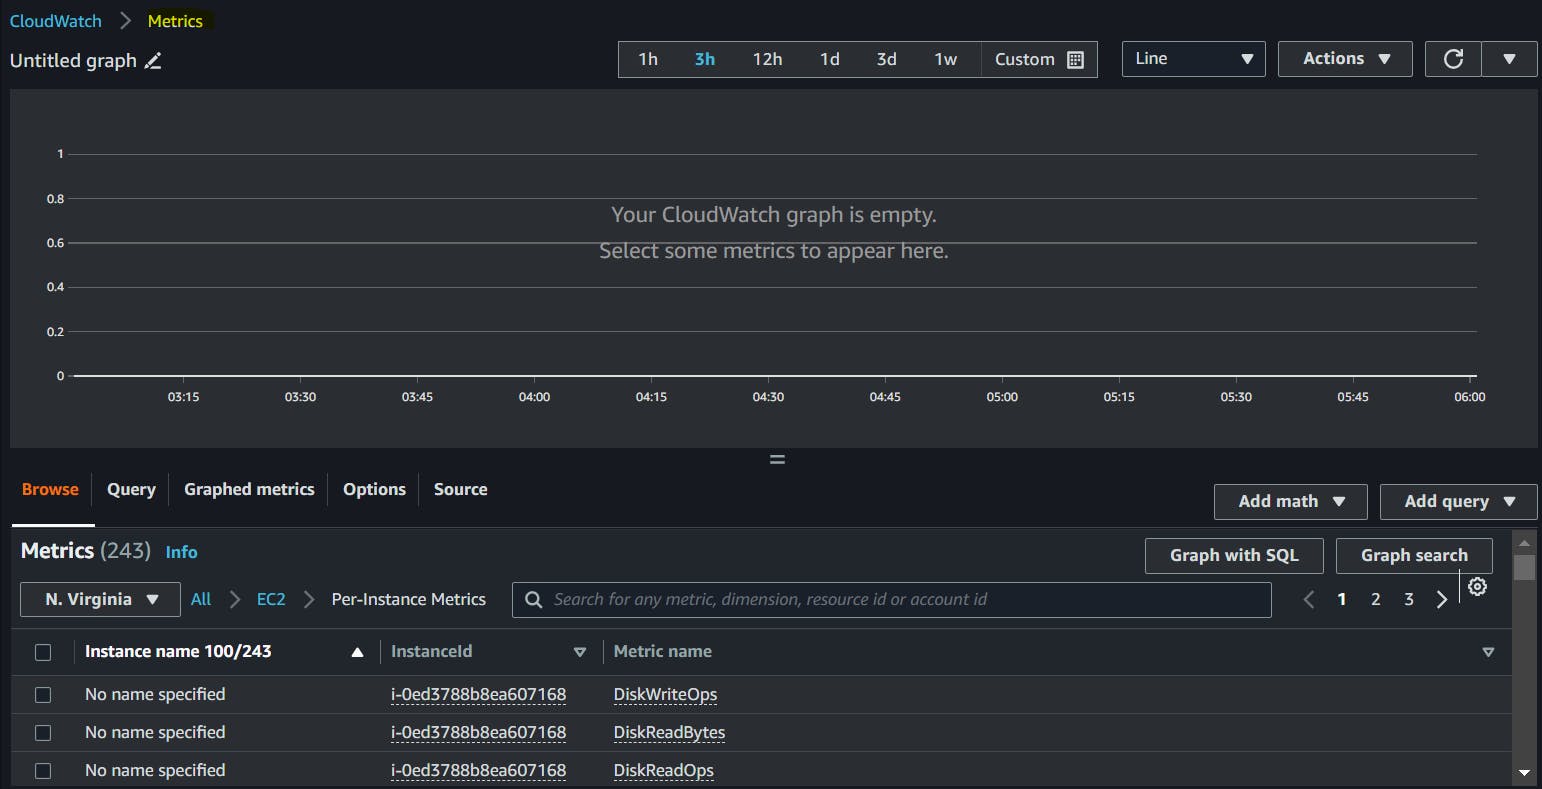
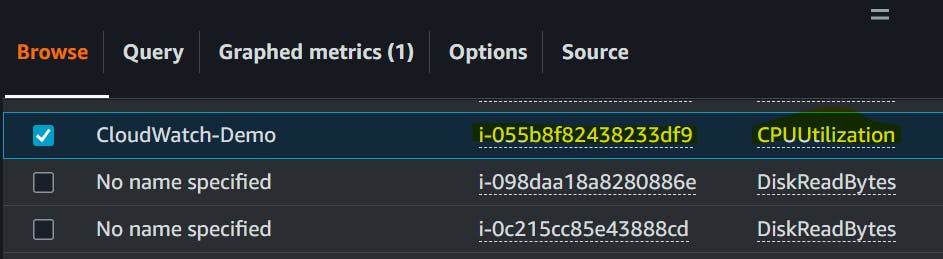
Now, identify the instance you just created and select the instance with the Metric name CPUUtilization as we want to track the CPU utilization. If you have some other Metric requirement add that under the instance.
To get the detailed monitoring of instance click on Manage detailed monitoring and confirm.

Right now it is not displaying anything, the CloudWatch graph is empty as I just created the ec2 instance.
Now go back to your instance and click on your instance. If you select your particular instance and scroll down, there is a Monitoring tab.
Go to the Monitoring tab and here you can find all this information and all of this information is related to CloudWatch.
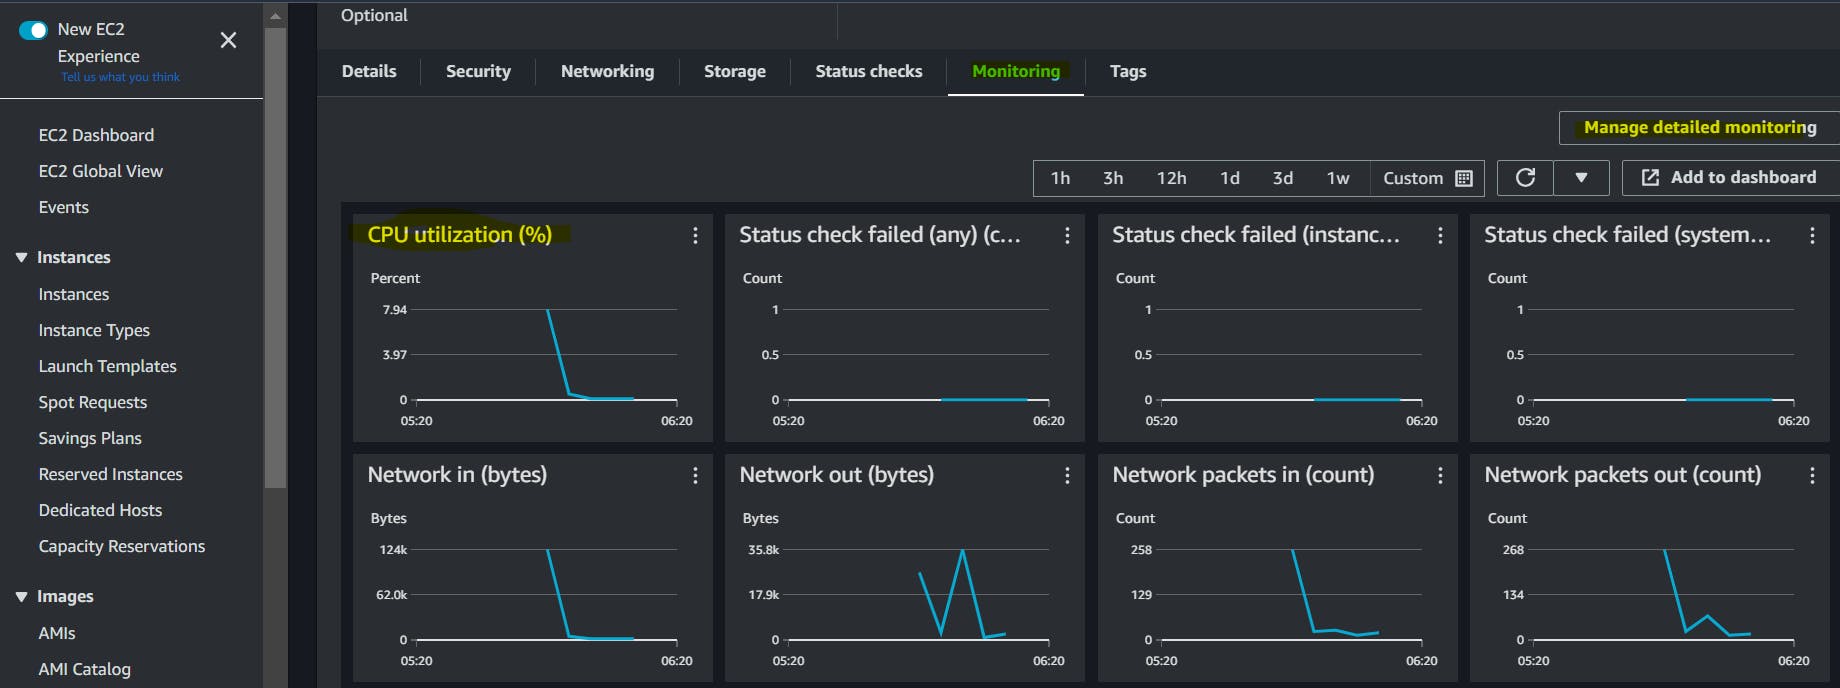
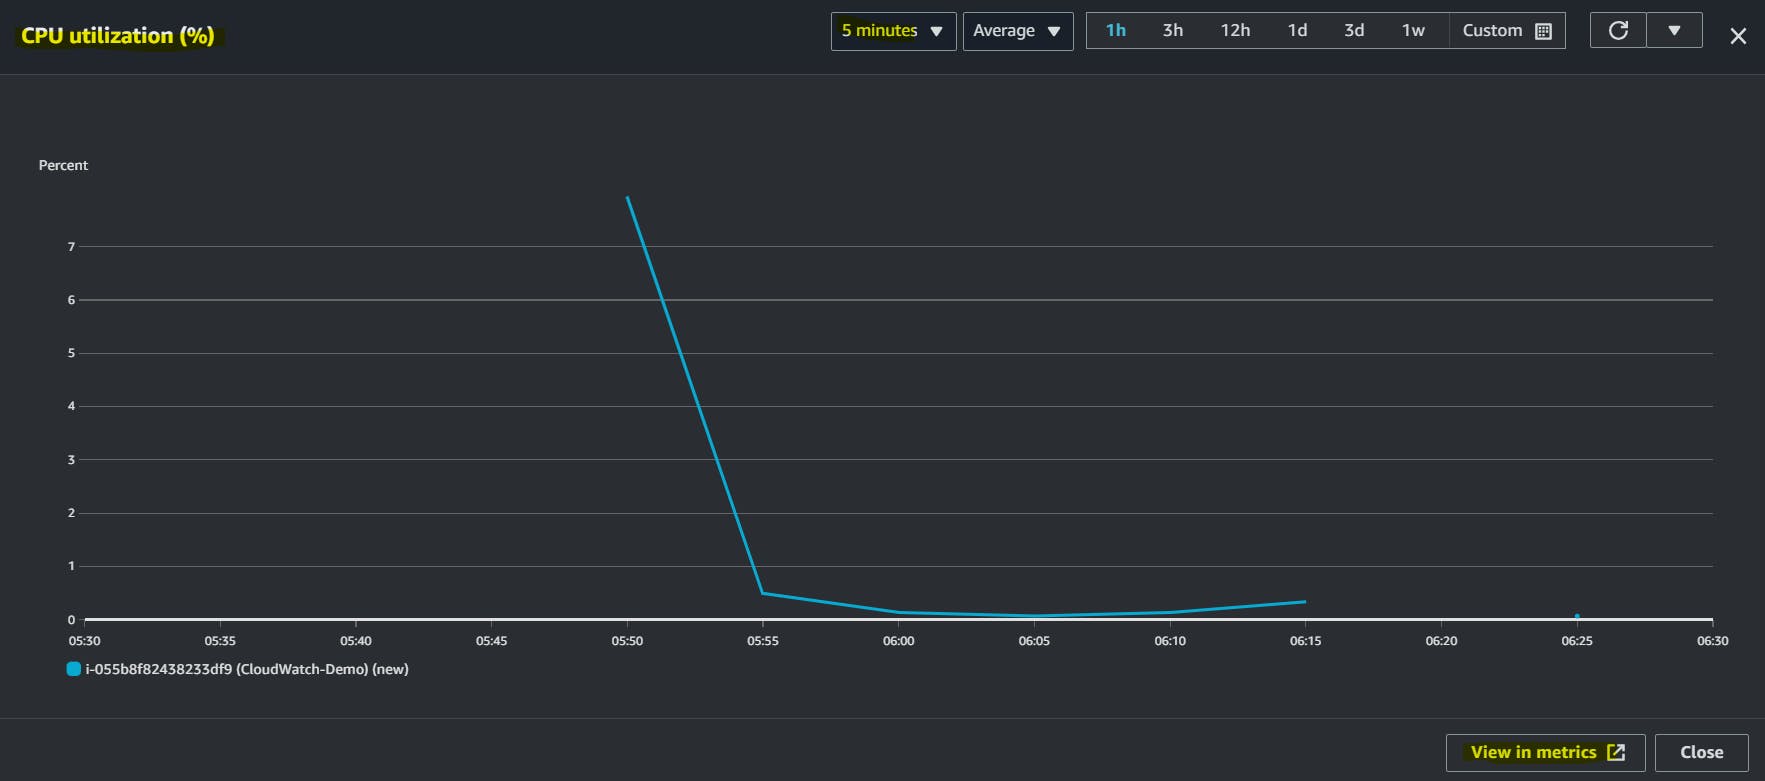
This one lets you expand on one of these Metrics for getting this information. These are CloudWatch metrics only so this information is collected from that.
There is an option where you can control how frequently you want to send information to CloudWatch. It depends on service to service by default EC2 instance sends metrics information in every five minutes.
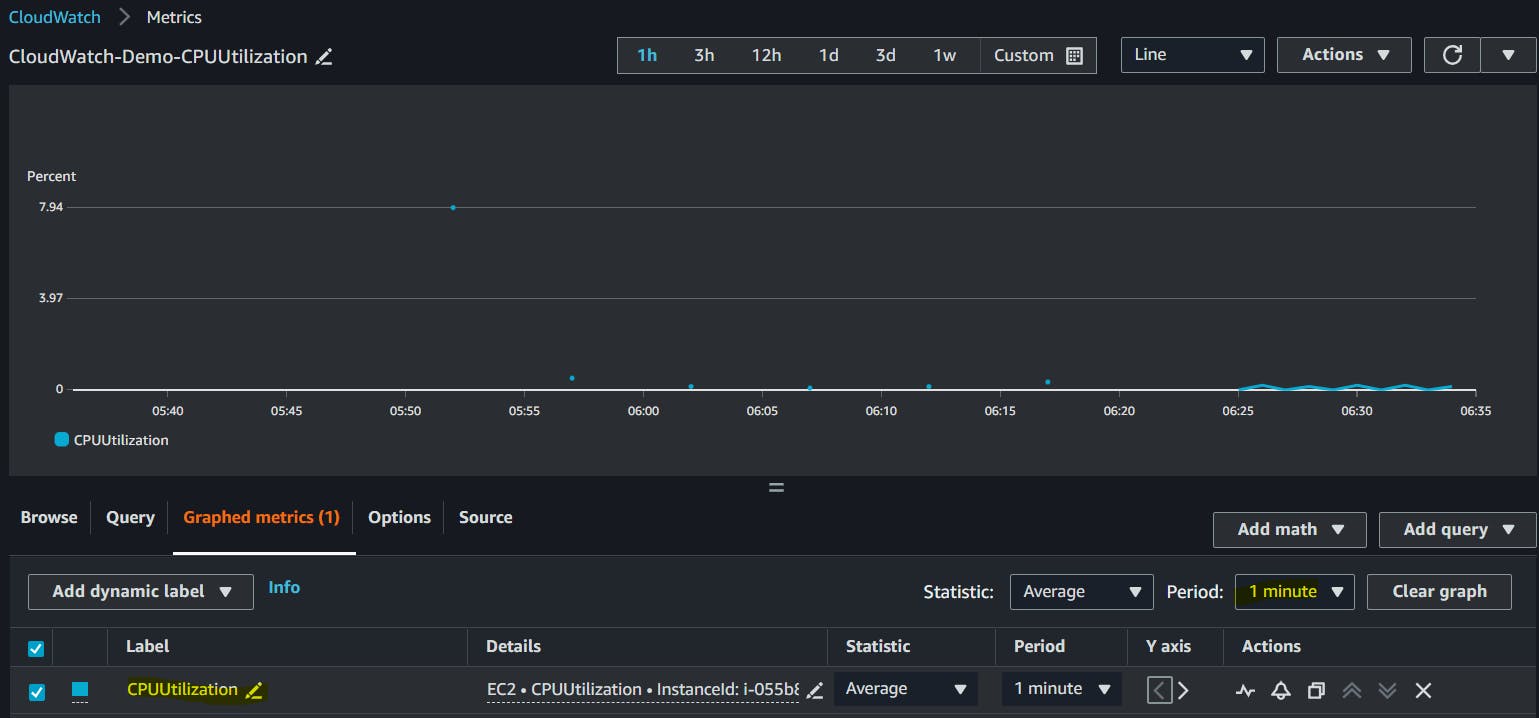
If you click on the View in Metrics button at the bottom you will be ultimately navigated to CloudWatch metrics only.
So this CPU utilization Marics is currently sending metrics in every five minutes but what you can do is you can go to manage detail monitoring the Matrix is to be sent every one minute as shown above.
This will help us to immediately send the Matrix and I can show you in
the AWS cloudwatch console.
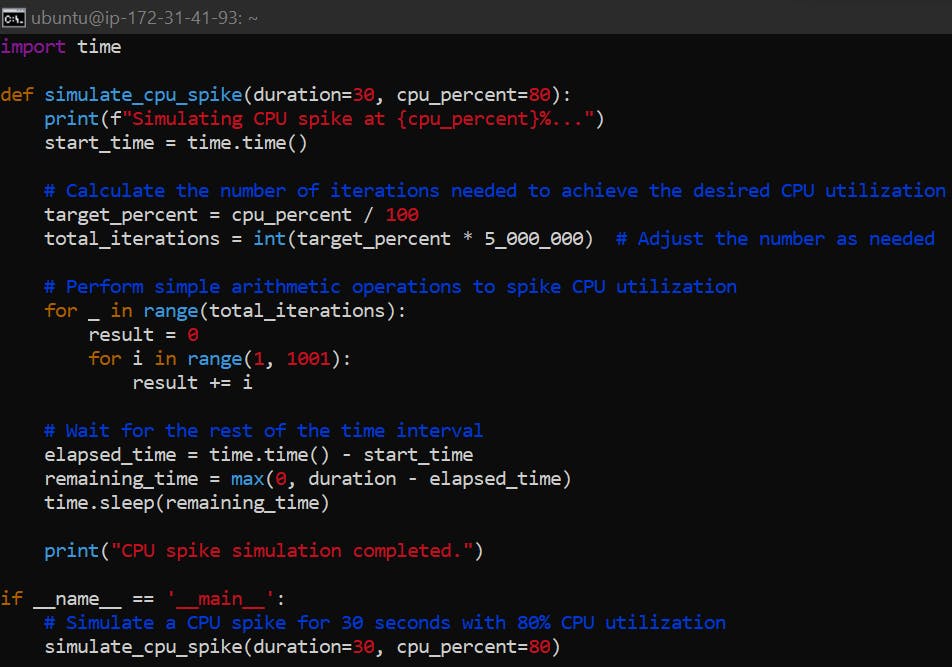
Now I'll go to my console. I'll open a file called cpu_spike.py
We are trying to increase CPU utilization and we are trying to see if CloudWatch is working fine or not.
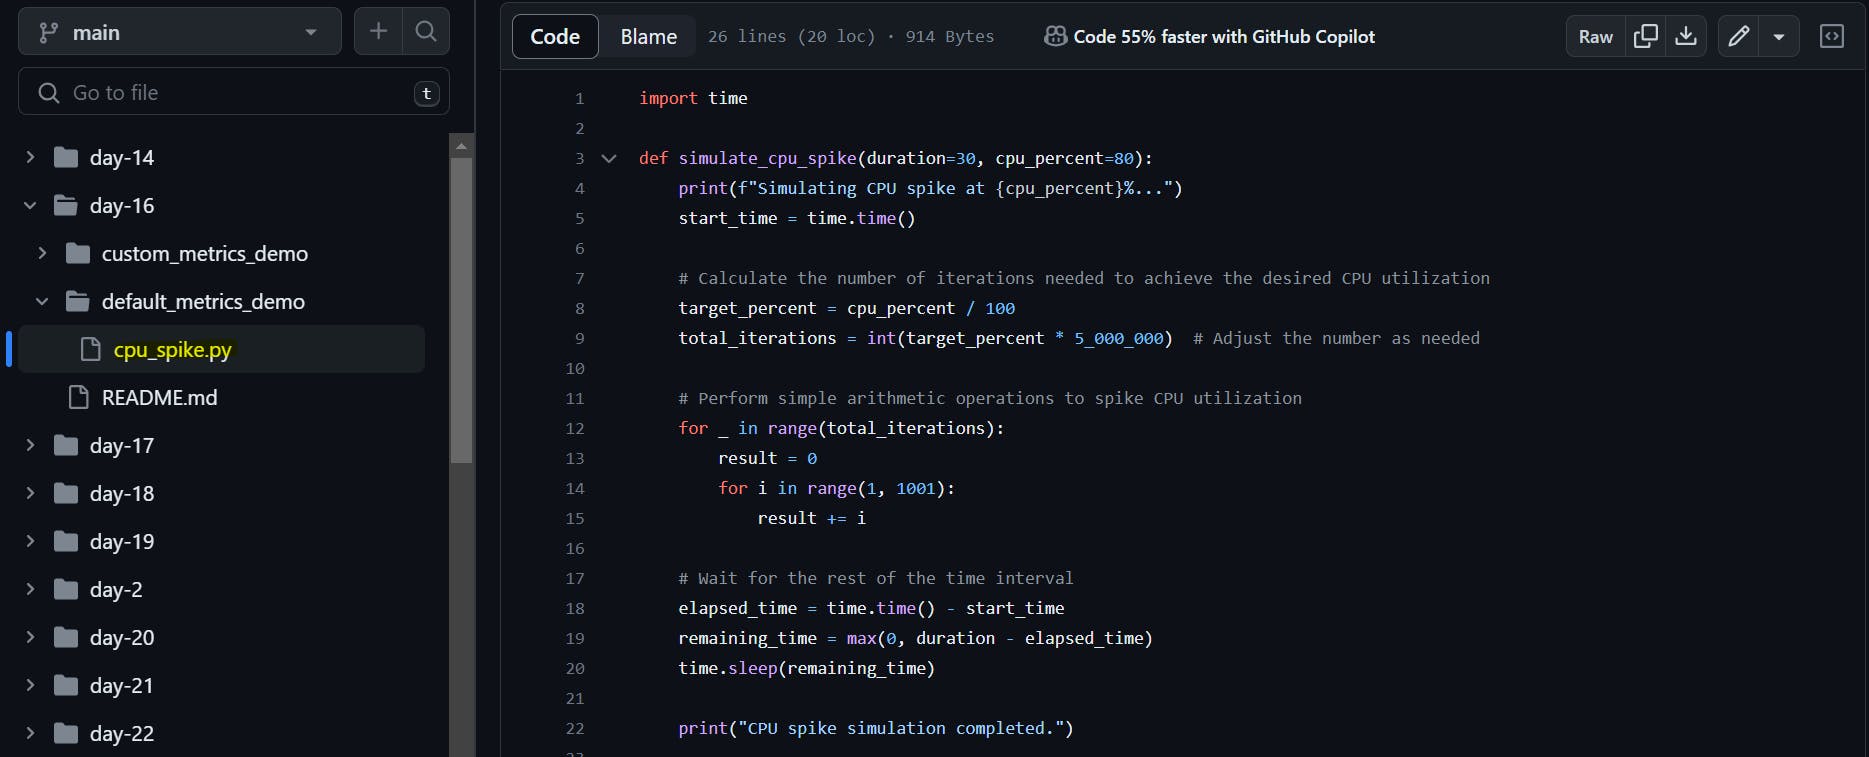
Let me copy this cpu_spike.py If you want to use it for demo purposes you can find this script here "The Script for CPU spike".

Also, observe the CPU utilization in metrics which is stable for now.
I just need to verify if I have Python 3 or not perfect Python 3.

Let's run this program.
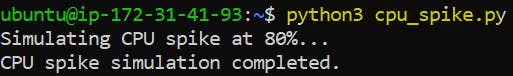
Now it will take one minute to report information back refresh and see.
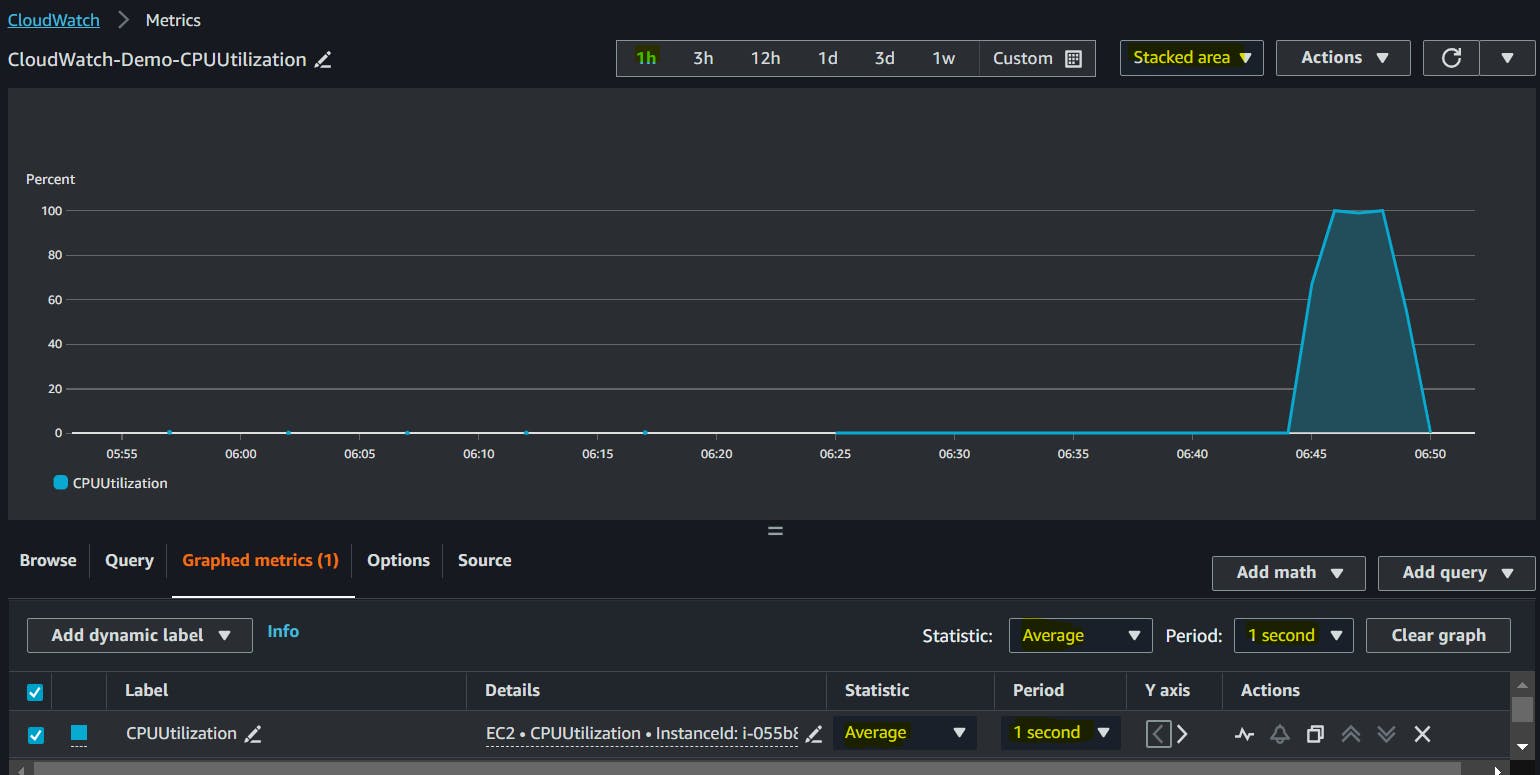
You can see it started collecting and what did it say the CPU was spiked to 100%
You can get the information in different types as well if you want you can get that in the pie charts, bar or lines.
In organizations, we will use average metrics.
Now, the simulation is completed and my program has come back to normal. Now if you look at CPU it will be 0 again.
Now, if you go to your EC2 instance details and click on CPUUtilixation you will get a beautiful graph.
Creating alarm
One of the jobs of DevOps Engineers is when you see this kind of issue you have to immediately report it.
So how you can configure alarms on CloudWatch?
So with metrics we collected all the information we got to know that okay one of the EC2 instance
In CloudWatch if the CPU has spiked to 50% if the CPU utilization spike has reached 50 percent then send me a notification and give me an email. Even if I am online or offline there are support Engineers, there are production Engineers, there are production management team or SRE Engineers or DevOps Engineers you can watch for these metrics if you are online or offline are working or not working you will get a notification
on your mobile and if it is a critical thing then you have to immediately log into your laptop and immediately act on it. So for Engineers not to be active 24x7, you can make use of alarms and these alarms will notify you when something is going wrong in your critical systems.
So how to create an alarm SNS topic?
In AWS to send out notifications we will use a service called SNS topics i.e. simple notification service topic. So let's understand that SNS is a service that is simple notification service and using SNS you can send out emails you can send out any kind of information.

Click on Create Alarm.
Select the kind of metrics that you want for The alarm.

I want metrics related to the EC2 instance click on the EC2 instance now click on across all instances or for instance metrics let's go for instance Matrics because I know that I just have one EC2 instance.
What is that Matrics CPU utilization search for it as I have highlighted in below screenshot.
All --> EC2 --> Across All instances --> CPUUtilization.
Click on select metric.

What kind of alarm do you want to configure?
Here you can say Matrics name is CPU utilization.
Instance is this one do you want average or maximum? Because this is a demo let's select Maximum because we can't wait for so much time in the demo if you are doing this in your organization select it as average and keep the average time for five minutes so you will get this email or you will get this message then you can configure slack messages or you can configure emails you can configure different kinds of things.
The easiest one is email and usually, organizations have an average.
If in five minutes you find CPU Spike send me an email one of us will log in and we will try to see what is the issue or we will tell the concerned development teams that something is going wrong.
But here for the demo let's say a maximum of one minute.

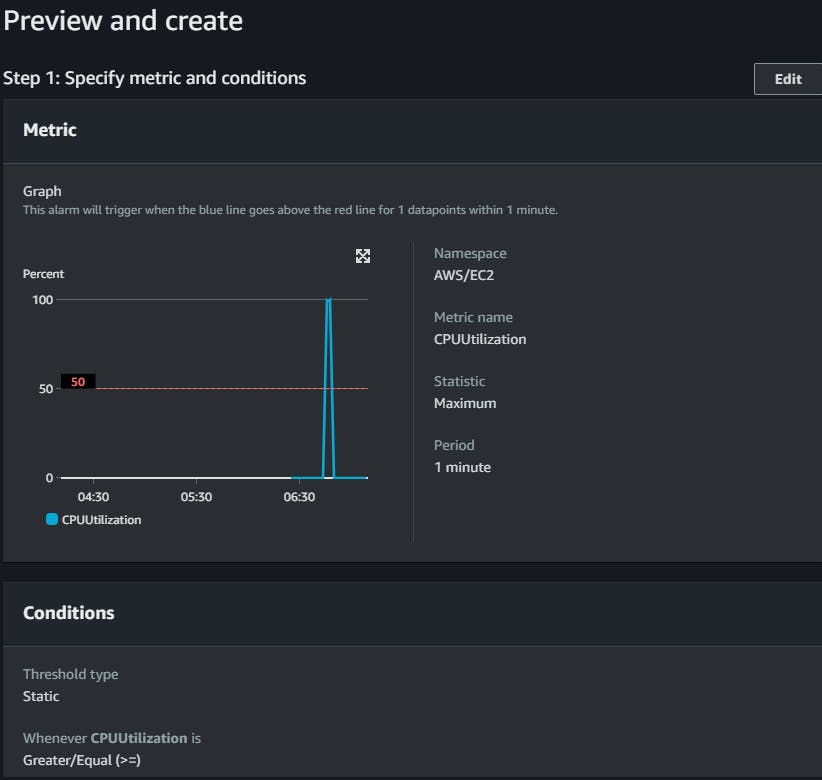
Threshhold type: Static
Whenever CPUUtilization is..: greater/Equal
than : 50
Click on next.

Alarm state trigger: In alarm
Create a new topic.
Topic name: CloudWatch_Alarm

All configurations remain the same and click on next.

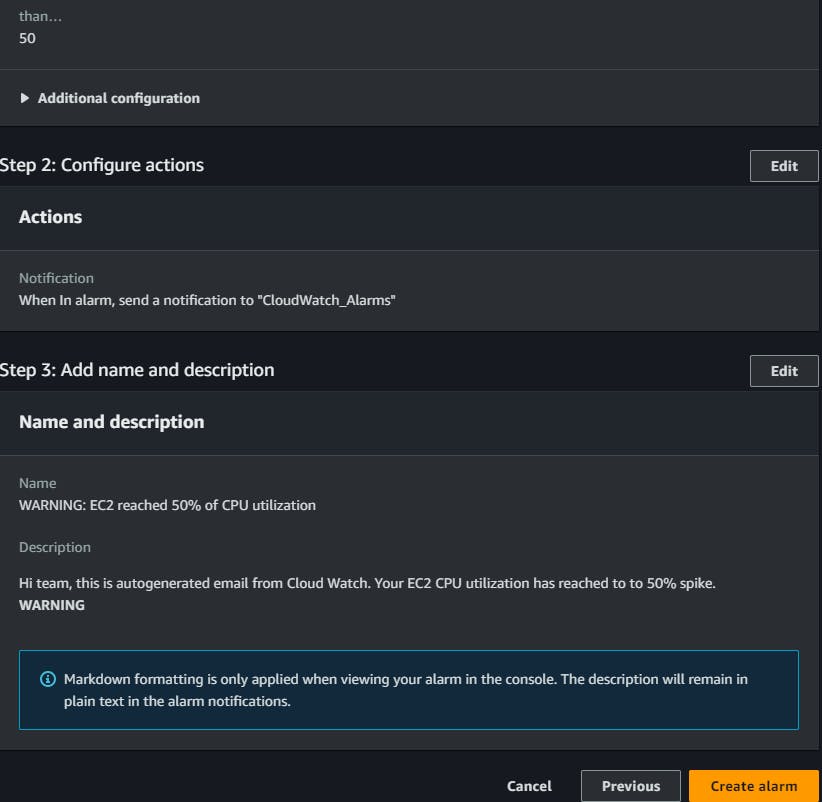
Provide Alarm name:
Alarm description:
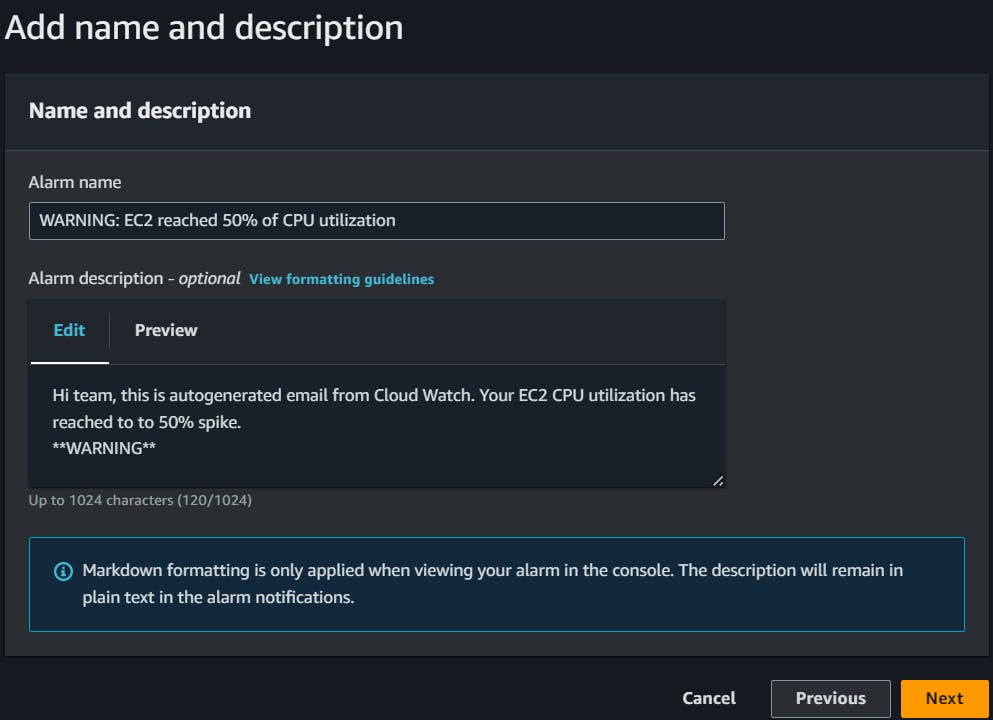
Check the preview and click on create alarm.
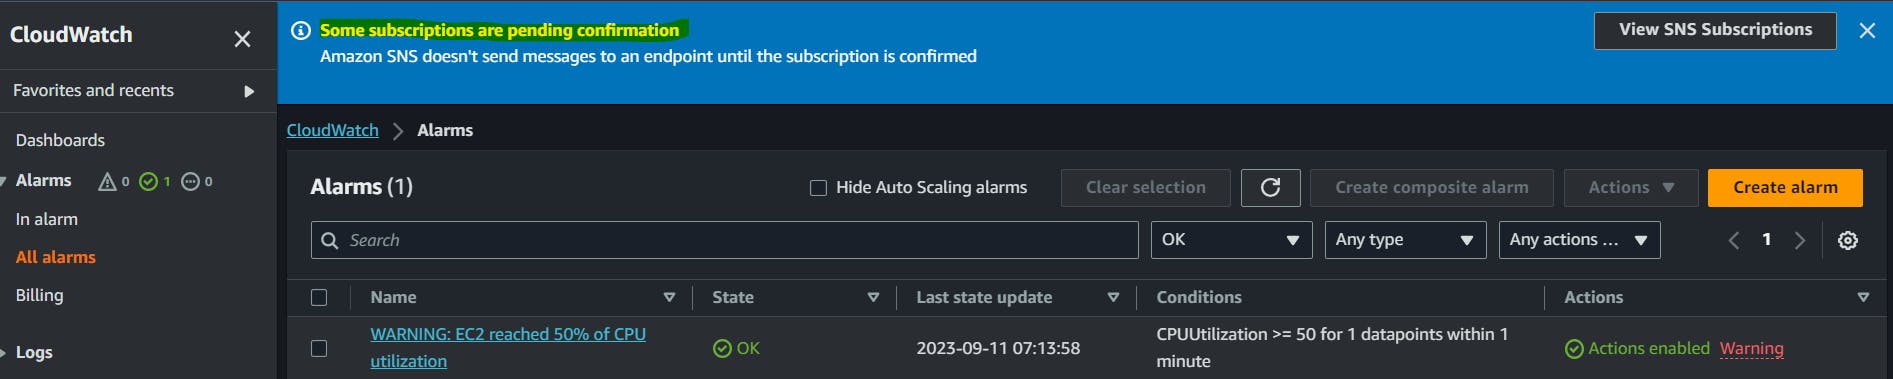
We can see the alarm is created successfully.

Now if you refresh the whole page, you can see a pop-up that Some subscriptions are pending confirmation.
Now go to the provided email address account and click on Confirm subscription.

Now, go to the alarm console and refresh it, We can see in the Actions column that Action enabled.

Now alarm is activated but you will not receive any notification at this point of time because the alarm is not triggered. So we will trigger the alarm from our terminal with the program cpu_spike.py
Increasing the CPU usage It will simulate the CPU usage increase and after a while, your CloudWatch alarm will get triggered from the metrics and this alarm will send out the notification let's wait for it.

As soon as CPU Utilization reaches 50%, an email is triggered as follows to the registered email account.

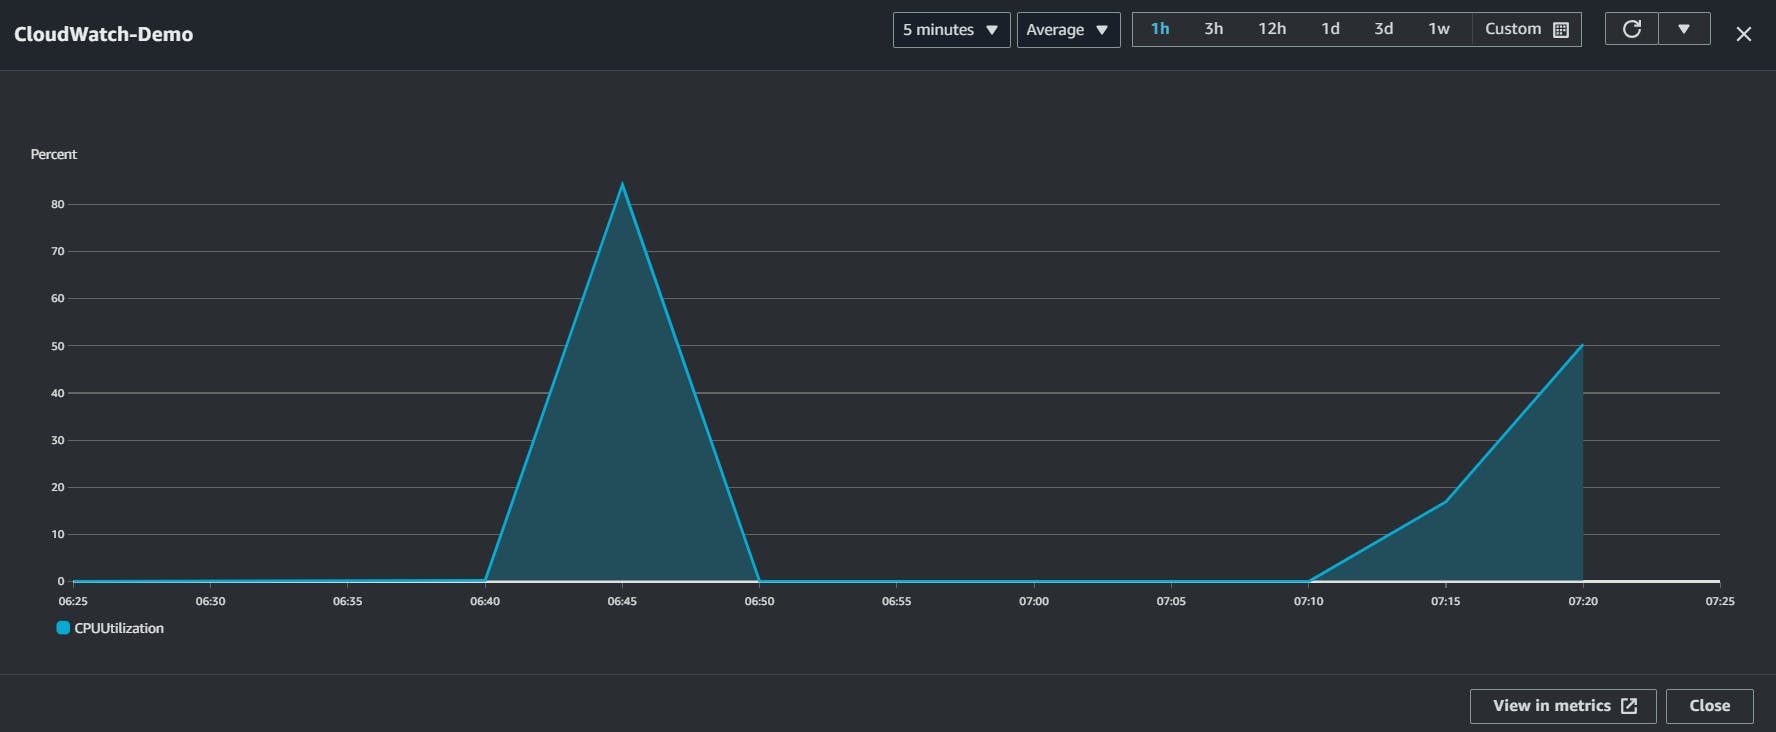
Meanwhile you can keep tracking this information. Once it reaches the red line the CPU utilization then you will get the notification.
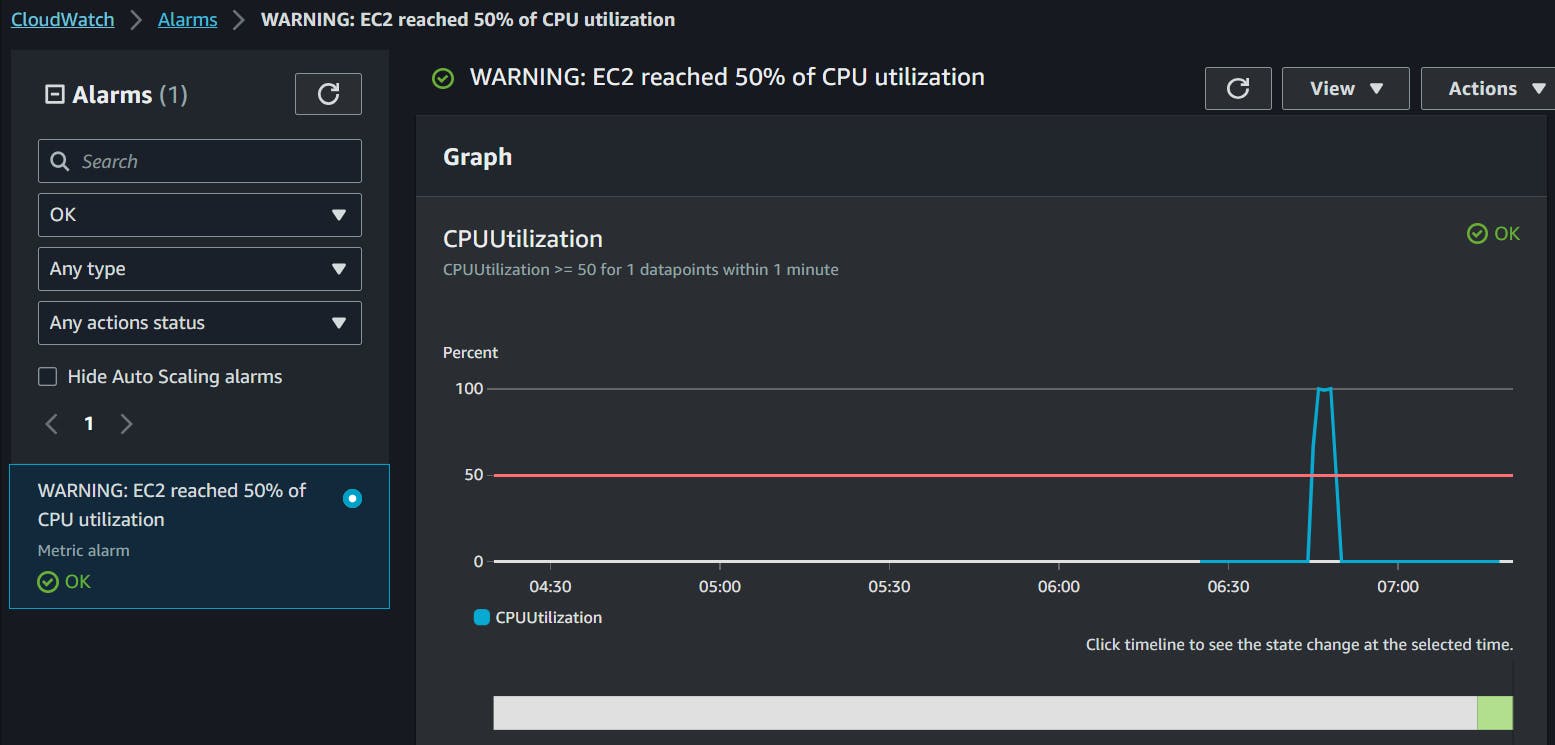
You navigate to CloudWatch --> Alarms -->
Observe the CPU utilization graph as follows.

Creating a CloudWatch dashboard.\
You can create a dashboard and you can track a particular metric or group of metrics that you want you want to track.
CloudWatch --> Dashboard --> Create dashboard.

Select the widget you want.
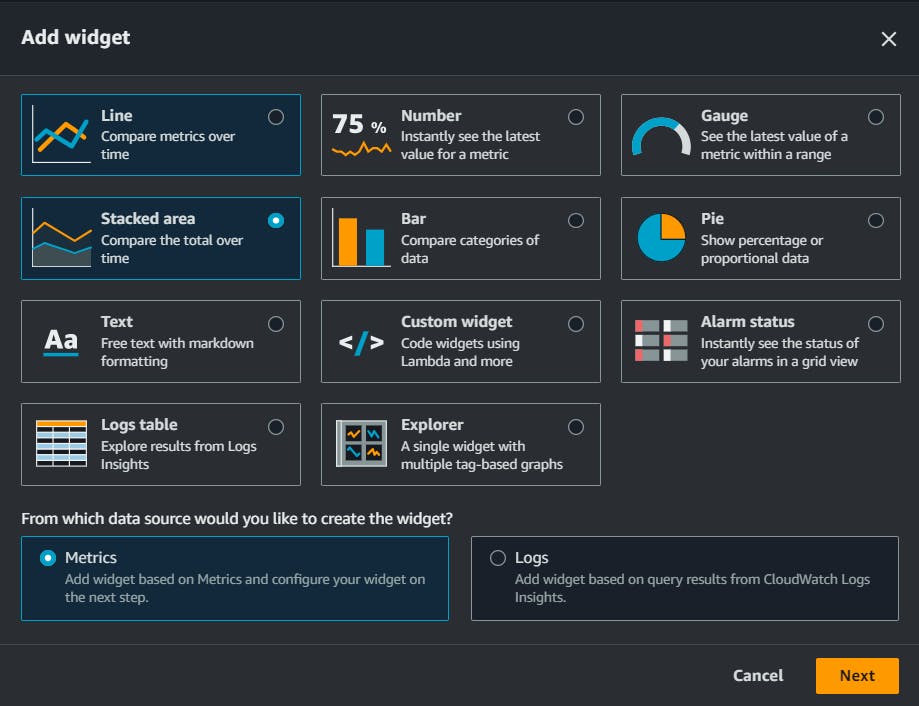
Click on create widget.

You can now aceess uor dashboard.

In this blog, I have discussed CloudWatch and SNS Services in AWS. If you have any questions or want to share your experiences, please comment below. Don't forget to read my blogs and connect with me on LinkedIn and let's have a conversation.
In the next blog post, we will explore more advanced topics in the realm of DevOps.So, stay tuned and let me know if there is any correction.
Please feel free to connect.
Git Hub Repo: Task Day46
Thank you for reading!